Weekly Market Update November 21, 2022
Weekly Market Update November 21, 2022
Presented by Zachary R. Sturdy
General Market News
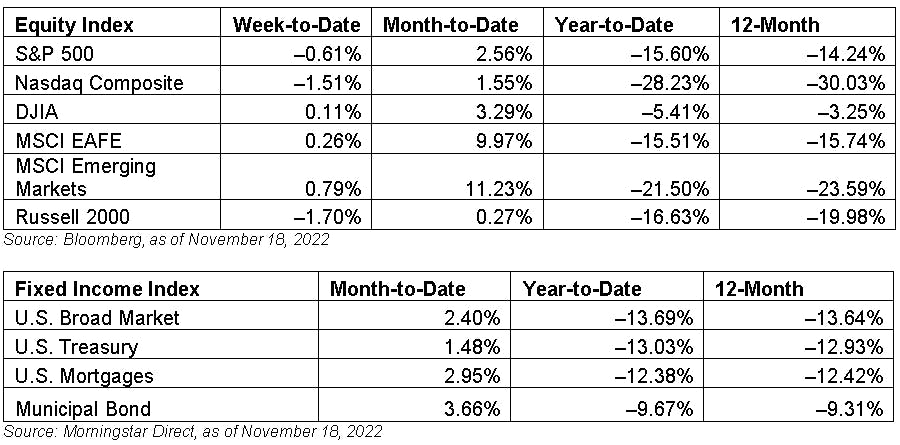
· Despite seeing some recent data that potentially points to a slowing pace of inflation, there is still tightening to be done. Core Consumer Price Index (CPI) data for October increased 0.3 percent month-over-month, but Federal Reserve (Fed) officials have indicated that this better-than-expected result should not be seen as a sign that the inflation fight is over. St. Louis Fed President James Bullard noted, “Thus far, the change in monetary policy stance appears to have had only limited effects on observed inflation . . .” He went on to say, “To attain a sufficiently restrictive level, the policy rate will need to be increased further.” The U.S. Treasury curve twisted slightly last week. The 2-year and 5-year gained 17 basis points (bps) (to 4.5 percent) and 4 bps (to 3.98 percent), respectively. The 10-year and 30-year fell 2 bps (to 3.79 percent) and 13 bps (to 3.89 percent), respectively.
· Equity market performance was mixed last week as we saw varied commentary from Federal Open Market Committee (FOMC) members. FOMC Vice Chair Lael Brainard echoed the sentiment of James Bullard in that the Fed was potentially looking at slowing the pace of future rate hikes. The Fed’s continued hiking cycle saw inflationary plays such as consumer discretionary, energy, REITs, and materials sell off. The Nasdaq Composite also underperformed its Dow Jones and S&P 500 counterparts as growth stocks continued their underperformance in the face of higher costs of capital going forward. International markets fared a bit better with the MSCI Emerging Market Index up 79 bps as China has showed signs of easing some Covid-19 policies despite rising infection rates. Consumer staples, health care, and utilities outperformed, led by earnings from Walmart (WMT) as the store benefits from its food/staples business.
· Last week’s data was focused on retail sales and the housing market, starting with the release of October retail sales data on Wednesday. Both headline and core retail sales growth came in above expectations, signaling continued resilience for the American consumer.
· The week wrapped with the release of existing home sales for October. Existing home sales fell less than expected. This does mark 10 consecutive months with declining home sales, however, as rising prices and mortgage rates continue to cool the housing sector.

What to Look Forward To
This week’s data will be light as a result of the Thanksgiving holiday.
Wednesday will see the release of durable goods orders and the FOMC meeting minutes from November. Business spending is set to increase for the third consecutive month in October. Economists and investors will look to the minutes for any hints on the future path of monetary policy.
Disclosures: Certain sections of this commentary contain forward-looking statements that are based on our reasonable expectations, estimates, projections, and assumptions. Forward-looking statements are not guarantees of future performance and involve certain risks and uncertainties, which are difficult to predict. All indices are unmanaged and are not available for direct investment by the public. Past performance is not indicative of future results. The S&P 500 is based on the average performance of the 500 industrial stocks monitored by Standard & Poor’s. The Nasdaq Composite Index measures the performance of all issues listed in the Nasdaq Stock Market, except for rights, warrants, units, and convertible debentures. The Dow Jones Industrial Average is computed by summing the prices of the stocks of 30 large companies and then dividing that total by an adjusted value, one which has been adjusted over the years to account for the effects of stock splits on the prices of the 30 companies. Dividends are reinvested to reflect the actual performance of the underlying securities. The MSCI EAFE Index is a float-adjusted market capitalization index designed to measure developed market equity performance, excluding the U.S. and Canada. The MSCI Emerging Markets Index is a market capitalization-weighted index composed of companies representative of the market structure of 26 emerging market countries in Europe, Latin America, and the Pacific Basin. The Russell 2000® Index measures the performance of the 2,000 smallest companies in the Russell 3000® Index. The Bloomberg US Aggregate Bond Index is an unmanaged market value-weighted performance benchmark for investment-grade fixed-rate debt issues, including government, corporate, asset-backed, and mortgage-backed securities with maturities of at least one year. The U.S. Treasury Index is based on the auctions of U.S. Treasury bills, or on the U.S. Treasury’s daily yield curve. The Bloomberg US Mortgage Backed Securities (MBS) Index is an unmanaged market value-weighted index of 15- and 30-year fixed-rate securities backed by mortgage pools of the Government National Mortgage Association (GNMA), Federal National Mortgage Association (Fannie Mae), and the Federal Home Loan Mortgage Corporation (FHLMC), and balloon mortgages with fixed-rate coupons. The Bloomberg US Municipal Index includes investment-grade, tax-exempt, and fixed-rate bonds with long-term maturities (greater than 2 years) selected from issues larger than $50 million. One basis point is equal to 1/100th of 1 percent, or 0.01 percent.
###
Zachary R. Sturdy is located at 307 S. Front St., Ste: 107 Marquette MI, 49855 and can be reached at (906)226-6056.
Securities and Advisory Services offered through Commonwealth Financial Network, member FINRA/SIPC, a Registered Investment Adviser. Fixed insurance products and services offered through CES Insurance Agency.
Authored by the Investment Research team at Commonwealth Financial Network.
© 2022 Commonwealth Financial Network®